Pinpointing Pollutants from Space
New method improves identification and quantification of nitrogen oxide sources by satellite
Nitrogen oxides (NO and NO2) are major contributors to air pollution. In order to accurately predict air quality and develop strategies to reduce pollution, precise emission data are needed. Daily satellite measurements can help to derive such data. The measuring instrument observes a specific area and records all pollutants it detects between the ground and the satellite. Since pollutant levels often vary considerably, they are usually averaged over a period of several months. However, changing winds “smear out” the emission values derived from space and thus reduce the spatial resolution of the measurements.

Scientists from Germany, China and the U.S.A. have now succeeded in significantly improving the spatial resolution of nitrogen oxide emission data and are thus able to better determine the amount of emitted pollutants. In the current issue of Science Advances, the team led by the Max Planck Institute for Chemistry reports that it combined wind data with measurements from the S5P/TROPOMI research satellite, which the European Space Agency (E.S.A.) launched recently. The horizontal transport of the pollutant can be used to deduce the underlying emissions and thereby the smearing of the signal can be backcalculated.
Industrial plants can be precisely located to within two kilometers
“Our method makes it possible to localize emission sources, such as coal-fired power plants, from background pollution with an accuracy of up to two kilometers,” says Steffen Beirle, lead author of the study. “We can also quantify the amounts of pollutants emitted with greater reliability.” According to Beirle, it is now possible to test whether emissions inventories are up to date, for example, or to identify spatial patterns. National and international conventions, such as the Kyoto Protocol, require countries to report how many greenhouse gases and air pollutants they produce. These data are recorded in the emissions inventories.
Using this new method, a detailed pattern of nitrogen oxide emissions was created for the area around Riyadh, the capital of Saudi Arabia, mapping the emissions of the various oil and gas-fired power plants in that area. The emissions pattern clearly identifies point sources and can separate power plants from other sources, such as traffic. The scientists repeated this exercise for Germany and South Africa, where coal-fired power plants are the largest single sources of nitrogen oxide emissions.

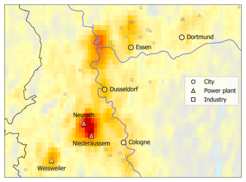
Nitrogen oxide emissions in the northern Rhineland region. Analysis of averaged satellite data obtained from April to October 2018 using the new method clearly distinguishes the emissions produced by the Niederaussem and Neurath lignite-fired power plants from those of the cities of Cologne and Düsseldorf. Source: MPIC, S. Beirle
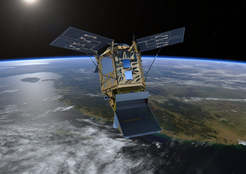
The researchers measured nitrogen oxide values using the Tropospheric Monitoring Instrument TROPOMI. The spectrometer has been orbiting the Earth on board E.S.A.'s Sentinel-5 Precursor (S-5P) satellite since October 2017. In addition to nitrogen oxides, it also measures other pollutants and greenhouse gases, for instance carbon monoxide, formaldehyde, ozone, and methane.